Week 02: Introduction to working with data#
Learning objectives#
In this lesson we learn how to summarize data in a DataFrame, and do basic data management tasks such as making new variables, recoding data, and dealing with missing data.
After completing this lesson, you should be able to
identify missing values in a dataset
summarize variables contained in a DataFrame
make new variables and insert them into a DataFrame
edit variables contained in a DataFrame
Throughout this notebook, we’ll use the dataset msleep from the packages
plotnine.
Preparation#
To follow along with this Lesson, please open the Colab notebook Week 02 Notes. The first code cell of this notebook calls to the remote computer, on which the notebook is running, and installs the necessary packages. For practice, you are repsonible for importing the necessary packages.
Missing data#
Missing data occurs when the value for a variable is missing. Think of it as a blank cell in an spreadsheet. Missing values can cause some problems during analysis, so let’s see how to detect missing values and how to work around them.
Let’s use the dataset msleep from the package plotnine.
from plotnine.data import msleep

import plotnine as pn
import numpy as np

msleep
| name | genus | vore | order | conservation | sleep_total | sleep_rem | sleep_cycle | awake | brainwt | bodywt | |
|---|---|---|---|---|---|---|---|---|---|---|---|
| 0 | Cheetah | Acinonyx | carni | Carnivora | lc | 12.1 | NaN | NaN | 11.9 | NaN | 50.000 |
| 1 | Owl monkey | Aotus | omni | Primates | NaN | 17.0 | 1.8 | NaN | 7.0 | 0.01550 | 0.480 |
| 2 | Mountain beaver | Aplodontia | herbi | Rodentia | nt | 14.4 | 2.4 | NaN | 9.6 | NaN | 1.350 |
| 3 | Greater short-tailed shrew | Blarina | omni | Soricomorpha | lc | 14.9 | 2.3 | 0.133333 | 9.1 | 0.00029 | 0.019 |
| 4 | Cow | Bos | herbi | Artiodactyla | domesticated | 4.0 | 0.7 | 0.666667 | 20.0 | 0.42300 | 600.000 |
| ... | ... | ... | ... | ... | ... | ... | ... | ... | ... | ... | ... |
| 78 | Tree shrew | Tupaia | omni | Scandentia | NaN | 8.9 | 2.6 | 0.233333 | 15.1 | 0.00250 | 0.104 |
| 79 | Bottle-nosed dolphin | Tursiops | carni | Cetacea | NaN | 5.2 | NaN | NaN | 18.8 | NaN | 173.330 |
| 80 | Genet | Genetta | carni | Carnivora | NaN | 6.3 | 1.3 | NaN | 17.7 | 0.01750 | 2.000 |
| 81 | Arctic fox | Vulpes | carni | Carnivora | NaN | 12.5 | NaN | NaN | 11.5 | 0.04450 | 3.380 |
| 82 | Red fox | Vulpes | carni | Carnivora | NaN | 9.8 | 2.4 | 0.350000 | 14.2 | 0.05040 | 4.230 |
83 rows × 11 columns
We can see that a few variables contain the value NaN, which stands for
not-a-number. These are the missing data. Notice that only the first
five and last five rows of the DataFrame are printed. The ellipsis,
…, in the middle row indicates not all rows are printed by default.
So we may not be able to see all the variables with NaNs. Each
column/Series has a property .hasnans which returns True if the
Series on which it is called has any NaNs.
msleep["conservation"].hasnans
True
Missing values are tricky to deal with in general. Much of the time
in Pandas, it seems like things just work out well for you. For
instance, calculating a mean or a standard deviation automatically
ignores NaNs.
np.mean(msleep["brainwt"])
np.float64(0.28158142857142854)
But other times, NaNs are not automatically ignored, and nothing
about the code or its output tells you when NaNs are ignored or not.
np.size(msleep["brainwt"])
83
The plotting package plotnine, by default, includes NaNs as its own category,
which can be undesirable.
p = pn.ggplot(data = msleep) + pn.geom_bar(pn.aes(x = "conservation"))
p.draw()

To remove the missing data from a plot, create a new DataFrame by
dropping the mising data from the column of interest. You should
always specify the keyword argument subset, lest you drop all
missing data, which might drop a row where the data is missing in a
column you care less about and subsequently drops data from the row
you do care about.
df = msleep.dropna(subset = "conservation")
p = pn.ggplot(data = df) + pn.geom_bar(pn.aes(x = "conservation"))
p.draw()
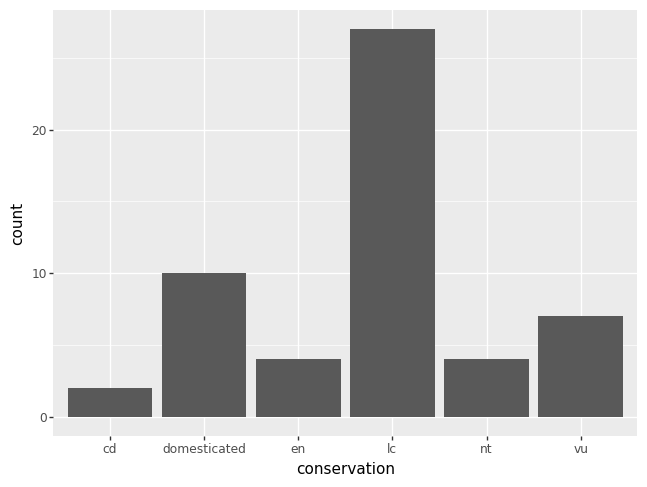
The code equivalent of the last plot above is as follows.
msleep["conservation"].value_counts(dropna = True)
conservation
lc              27
domesticated    10
vu               7
en               4
nt               4
cd               2
Name: count, dtype: int64
Summarize data#
In the subsection above, Missing data, we learned that accounting for
missing data can be tricky. The Pandas property
describe which excludes NaN values. Thus, you have a choice. Use
np.size if you want a count of the number of elements including
missing data, NaNs. Or use .describe if you want a count of the
number of elements excluding missing data.
Here, we call .describe on a Series of type category elements,
that is a categorical variable named conservation.
msleep["conservation"].describe()
count     54
unique     6
top       lc
freq      27
Name: conservation, dtype: object
Here, we call .describe on a Series of type float64 elements, that
is a numeric variables named brainwt.
msleep["brainwt"].describe()
count    56.000000
mean      0.281581
std       0.976414
min       0.000140
25%       0.002900
50%       0.012400
75%       0.125500
max       5.712000
Name: brainwt, dtype: float64
Since there is not much to be done with missing values other than count them, here is a line of code you can use to count the number of missing values.
nan_idx = msleep["conservation"].isna()
np.sum(nan_idx)
np.int64(29)
The property/function .isna returns a boolean Series where each
missing value is indexed by True and each non-missing value is
indexed by False. Since True is equivalent to the number 1 and
False is equivalent to 0 in Python, we can simply sum up the number
of Trues and Falses to count the number of missing data.
Creating/Editing new variables#
Imagine you want to create a new variable brnbdywt in the DataFrame
msleep. This new variable might tell you something about how smart
the animal is. The bigger the brain to body weight ratio, maybe the
smarter the animal is.
Just like for a dict, you can index into a DataFrame with a column
name that does not yet exist, so long as you first assign to that
column with some expression. For instance, let’s create a new
variable brnbdywt inside the DataFrame msleep, and assign to it
the ratio of the columns brainwt and bodywt.
msleep["brnbdywt"] = msleep["brainwt"] / msleep["bodywt"]
The division on the right hand side of = is done element-wise.
Therefore, the Series created by the division of two Series has the
same size as every column in msleep. We have thus assigned to the
new column brnbdywt a new variable that was created by the ratio of
brainwt to bodywt.
msleep["brnbdywt"].describe()
count    56.000000
mean      0.010356
std       0.009251
min       0.000705
25%       0.003794
50%       0.006956
75%       0.015244
max       0.039604
Name: brnbdywt, dtype: float64
We can take this one step further. Let’s create a new boolean
variable named smrt, which will hold True whenever an animal is in
the top 25% of the brain to body weight ratio and False otherwise.
We start by creating the new column and making every value equal to
False.
msleep["smrt"] = False
Since the right hand side of the equals is scalar, just one
value, it is recycled as much as necessary to create a new column in
msleep to keep the requirement that every column of a DataFrame has
the same size.
Next, we create a boolean Series that indicates when an animal
qualifies as smrt. Then, we over-write with the value True just
those rows for which we’ve identified a smrt animal. Hence, we can
edit a variable in a DataFrame using the indexing strategy we learned
about in Week 01: DataFrames.
smrt_idx = msleep["brnbdywt"] >= 0.015
msleep.loc[smrt_idx, "smrt"] = True
Categorical variables#
A categorical variable is a variable that has names or labels as
values. We basically created a categorical variable above, with only
two values True and False, and named it smrt. The only thing we
haven’t done is convinced Python/Pandas to treat the variable smrt
as if the elements are of type category. Let’s fix this.
msleep["smrt"] = msleep["smrt"].astype("category")
msleep["smrt"]
0     False
1      True
2     False
3      True
4     False
      ...
78     True
79    False
80    False
81    False
82    False
Name: smrt, Length: 83, dtype: category
Categories (2, bool): [False, True]
Invariably with categorical variables, the categories you have are
not what you want. Let’s change the categories from False and True to
something else.
msleep["smrt"] = msleep["smrt"].cat.rename_categories({False: "nope", True: "yup"})
There’s two things to note here. First, the property .cat can only
be called on a categorical Series; the elements must be recognized by
Python/Pandas as type category. Second, the argument to
.rename_categories is a dict with keys equal to the categories
that you have, but don’t want, and values equal to the categories you
want. The pattern in pseudo-code might be written as {"old": "new"}. The problem with this is that the keys don’t have to be of
type str, as we saw above.
We now have a variable with categories as names or labels,
instead of False and True, we can develop more categories. Let’s
break up the "Nope"s into two groups: "meh" for so-so smart
animals and "Nope". The "meh" group is in the middle. In order
to add this new category, we need to prime the Series smrt for the
fact that we want to add a category that doesn’t yet exist.
msleep["smrt"] = msleep["smrt"].cat.add_categories(["meh", "doh"])
Next, let’s create a boolean Series which indicates the exact rows
which should be labeled as "meh". The variable meh_idx is one
boolean Series created with logical and & of two boolean Series. In
an expression such as a & b, where a and b are both boolean
Series, each element of a is compared to each element of b. When
both elements are True, the corresponding element of meh_idx is
True. If either element is False, the corresponding element of
meh_idx id False.
meh_idx = (0.004 <= msleep["brnbdywt"]) & (msleep["brnbdywt"] < 0.015)
msleep.loc[meh_idx, "smrt"] = "meh"
msleep["smrt"]
0     nope
1      yup
2     nope
3      yup
4     nope
      ...
78     yup
79    nope
80     meh
81     meh
82     meh
Name: smrt, Length: 83, dtype: category
Categories (4, object): ['nope', 'yup', 'meh', 'doh']
The character &, read as ampersand, above is the logical equivalent
of the word and. The character |, read as pipe, is the logical
equivalent of the word or. To type an ampersand hold shift and
press the number 7 above the letters Y and U on your keyboard. To
type a pipe hold shift and press the backslash key, which is in
between enter/return and backspace/delete.
Did you notice that I added the unused category "doh"? On the
one hand, this shows that you can add multiple new categories at once,
just use a list. On the other hand, you may very well end up with an
unsed category after renaming various categories. Here’s how you can
remove any unused categories.
msleep["smrt"] = msleep["smrt"].cat.remove_unused_categories()
msleep["smrt"]
0     nope
1      yup
2     nope
3      yup
4     nope
      ...
78     yup
79    nope
80     meh
81     meh
82     meh
Name: smrt, Length: 83, dtype: category
Categories (3, object): ['nope', 'yup', 'meh']
The function remove_unused_categories() is a safe bet, because no used
category will be removed. Alternatively, the function
remove_categories([...])
will remove any specified categories, whether or not they are used. The
function documentation warns “Values which were in the removed categories will
be set to NaN”.
See also