import numpy as np
import matplotlib.pyplot as plt
rng = np.random.default_rng()N = 50 # number of data
x = rng.integers(1, 7, size = N) # Uniform(1, 6)np.mean(x == 4) # ¿close to 1 / 6?0.14np.mean(x) # ¿close to 3.5?3.76cx = np.cumsum(x == 1) # (x)
ndx = np.arange(np.size(x)) + 1
cm = cx / ndx # cumulative meanplt.plot(ndx, cm) # convergence plot
plt.axhline(1 / 6, color = "black", linestyle = "--") # 3.5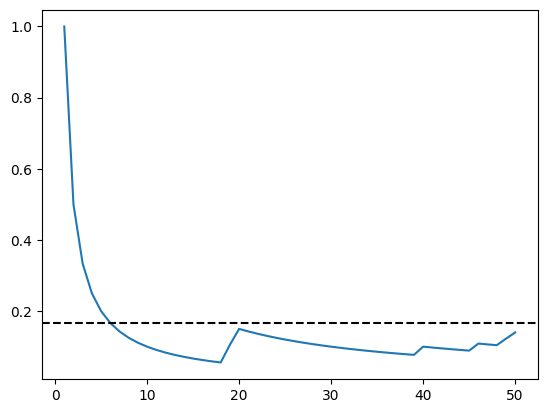
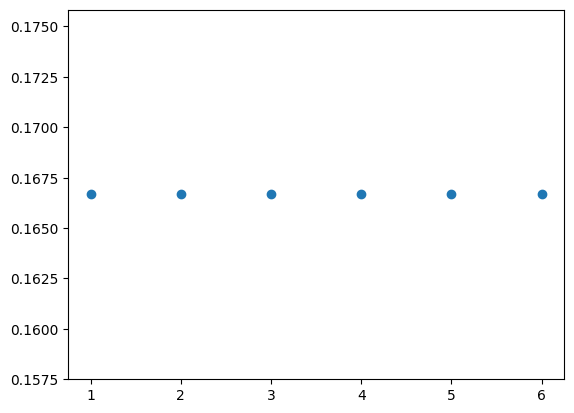
plt.scatter(np.arange(1, 7), np.ones(6) / 6) # density plot