import numpy as np
import matplotlib.pyplot as plt
rng = np.random.default_rng()
x = rng.normal(size = 10000)plt.hist(x, density = True, histtype = "step");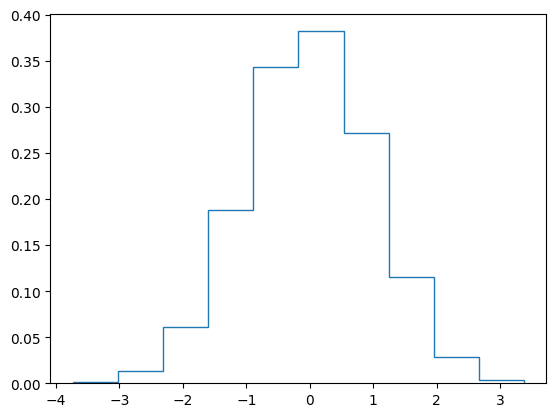
y = rng.exponential(size = 1000)
plt.hist(y, density = True, histtype = "step");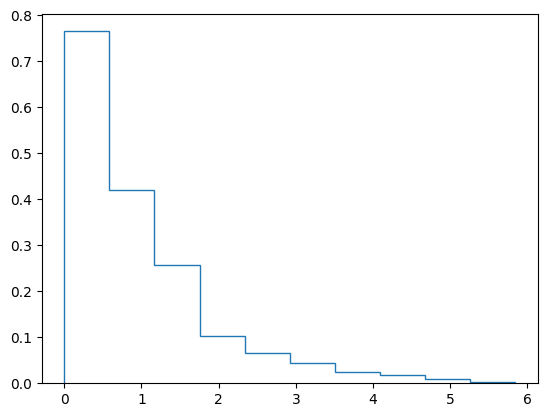
z = rng.poisson(size = 10000)plt.hist(z, density = True, histtype = "step", bins = 9);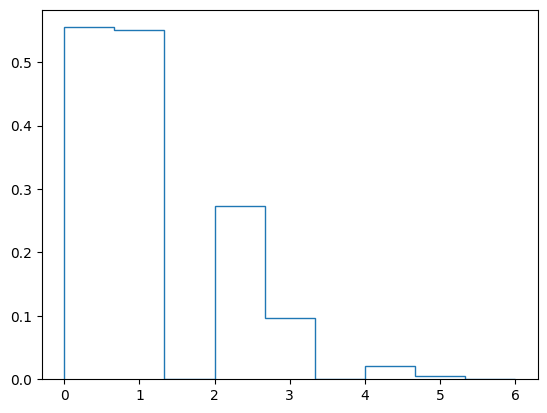
R = 100
N = 501
rng = np.random.default_rng()
ndx = np.arange(N) + 1
for r in range(R):
    x = rng.normal(size = N)
    cm = np.cumsum(x) / ndx
plt.plot(ndx, cm) 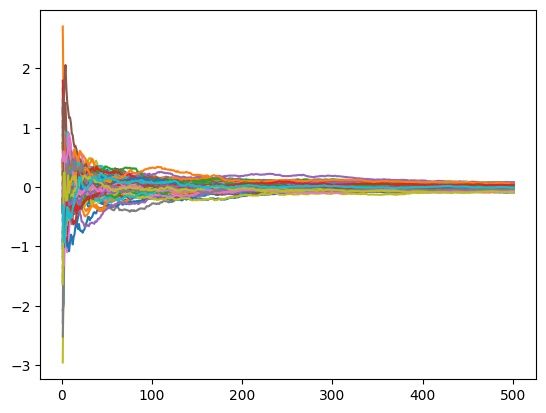
cms = np.zeros(R)
for r in range(R):
x = rng.normal(size = N)
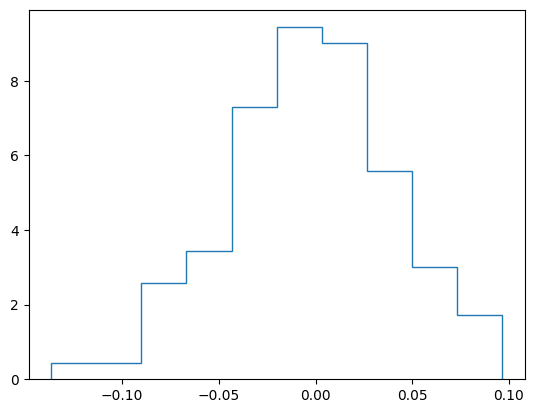
cms[r] = np.mean(x)plt.hist(cms, density = True, histtype = "step");