# instantiate and fit model here: log10 both x, y, and
# unique "intercepts" by SuperFamily
model = smf.ols("np.log10(SB) ~ SuperFamily + np.log10(SW)", data = df)
fit = model.fit()
mn, mx = np.min(df["SW"]), np.max(df["SW"])
x = np.linspace(mn, mx, 101)
ndf = pd.DataFrame.from_dict({
"SuperFamily": np.repeat(["Caniformia", "Feliformia"], 101),
"SW": np.tile(x, 2)
})
ndf["yhat"] = fit.predict(ndf)
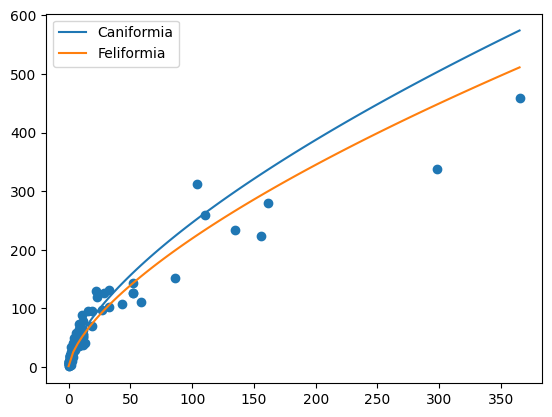
# make plot here: one line for each SuperFamily
plt.scatter(df["SW"], df["SB"])
for group, gdf in ndf.groupby("SuperFamily"):
plt.plot(gdf["SW"], 10 ** gdf["yhat"], label = group)
plt.legend()