import numpy as np
import matplotlib.pyplot as plt
import scipy.stats as st
import pandas as pd
from scipy.optimize import minimize
df = pd.read_csv("https://raw.githubusercontent.com/roualdes/data/refs/heads/master/donkeys.csv")df.head()| BCS | Age | Sex | Length | Girth | Height | Weight | WeightAlt | |
|---|---|---|---|---|---|---|---|---|
| 0 | 3.0 | <2 | stallion | 78 | 90 | 90 | 77 | NaN |
| 1 | 2.5 | <2 | stallion | 91 | 97 | 94 | 100 | NaN |
| 2 | 1.5 | <2 | stallion | 74 | 93 | 95 | 74 | NaN |
| 3 | 3.0 | <2 | female | 87 | 109 | 96 | 116 | NaN |
| 4 | 2.5 | <2 | female | 79 | 98 | 91 | 91 | NaN |
plt.scatter(df["Height"], df["Weight"])
plt.xlabel("Height (cm)")
plt.ylabel("Weight (kg)")
Text(0, 0.5, 'Weight (kg)')
def ll_regression(theta, data):
    x = data["x"]
    y = data["y"]
    b0 = theta[0]
    b1 = theta[1]
    return np.sum( (y - (b0 + b1 * x)) ** 2)
def ll_grad(theta, data):
x = data["x"]
y = data["y"]
b0 = theta[0]
b1 = theta[1]
lm = b0 + b1 * x
db0 = np.sum(y - lm)
db1 = np.sum( x * (y - lm) )
return -2 * np.array([db0, db1])rng = np.random.default_rng()
init = rng.normal(size = 2)
d = {
"x": df["Height"],
"y": df["Weight"]
}
o = minimize(ll_regression, init, jac = ll_grad, args = (d,))np.sum(o.x * np.array([1, 120]))237.0145972963091plt.scatter(df["Height"], df["Weight"])
plt.xlabel("Height (cm)")
plt.ylabel("Weight (kg)")
x1 = np.sum(o.x * np.array([1, 120]))
x0 = np.sum(o.x * np.array([1, 80]))
yhat = np.array([x0, x1])
x = np.array([80, 120])
plt.plot(x, yhat, color = "black");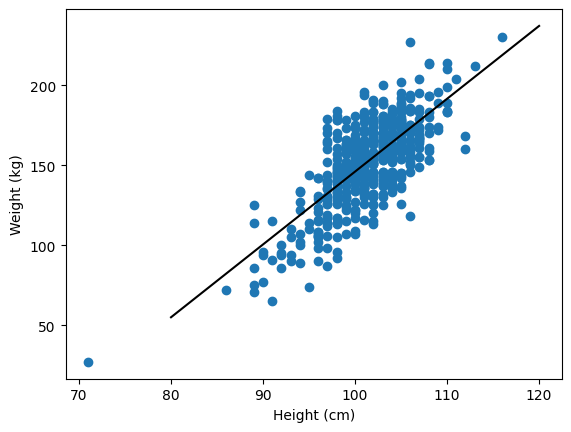
o.x[0]-309.30049352770055