import matplotlib.pyplot as plt
import numpy as np
import pandas as pd
import patsy as pt
from sklearn import datasets # pip install -U scikit-learn
import statsmodels.api as sm
import statsmodels.formula.api as smf
The start of this notebook is largely borrowed from: scikit learn’s page on ‘Recognizing hand-written digits’
digits = datasets.load_digits()

_, axes = plt.subplots(nrows=1, ncols=4, figsize=(10, 3))
for ax, image, label in zip(axes, digits.images, digits.target):
    ax.set_axis_off()
    ax.imshow(image, cmap=plt.cm.gray_r, interpolation="nearest")
    ax.set_title("Training: %i" % label)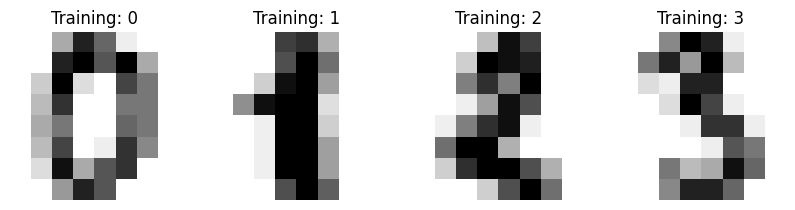
digits.images[1]array([[ 0., 0., 0., 12., 13., 5., 0., 0.],
[ 0., 0., 0., 11., 16., 9., 0., 0.],
[ 0., 0., 3., 15., 16., 6., 0., 0.],
[ 0., 7., 15., 16., 16., 2., 0., 0.],
[ 0., 0., 1., 16., 16., 3., 0., 0.],
[ 0., 0., 1., 16., 16., 6., 0., 0.],
[ 0., 0., 1., 16., 16., 6., 0., 0.],
[ 0., 0., 0., 11., 16., 10., 0., 0.]])n_samples = len(digits.images)
data = digits.images.reshape((n_samples, -1))
nrows, ncols = np.shape(data)
(nrows, ncols)(1797, 64)cols = np.array(["x" + str(m).zfill(2) for m in range(ncols)])
rng = np.random.default_rng()
train = rng.choice(nrows, size = int(np.floor(0.7 * nrows)), replace = False)
test = np.setdiff1d(np.arange(nrows), train)
np.any(np.isin(train, test)), np.size(train) + np.size(test)(False, 1797)dftrain = pd.DataFrame(data[train], columns = cols)dftrain["y"] = (digits.target[train] == 7).astype(np.float64)formula = "y ~ " + " + ".join(dftrain.columns[:-1])model = smf.glm(formula, data = dftrain, family = sm.families.Binomial())
fit = model.fit_regularized(alpha = 0.001, L1_wt = 0)digits.target[train][fit.predict(dftrain) > 0.5] array([7, 7, 7, 7, 7, 7, 7, 7, 7, 7, 7, 7, 7, 7, 7, 7, 7, 7, 7, 7, 7, 7,
7, 7, 7, 7, 7, 7, 7, 7, 7, 7, 7, 7, 7, 7, 7, 7, 7, 7, 7, 7, 7, 7,
7, 7, 7, 7, 7, 7, 7, 7, 7, 7, 7, 7, 7, 7, 7, 7, 7, 7, 7, 7, 7, 7,
7, 7, 7, 7, 7, 7, 7, 7, 7, 7, 7, 7, 7, 7, 7, 7, 7, 7, 7, 7, 7, 7,
7, 7, 7, 7, 7, 7, 7, 7, 7, 7, 7, 7, 7, 7, 7, 7, 7, 7, 7, 7, 7, 7,
7, 7, 7, 7, 7, 7, 7, 7, 7, 7, 7, 7, 7, 7, 7, 7])np.any(digits.target[train][fit.predict(dftrain) < 0.5] == 7)Falsedftest = pd.DataFrame(data[test], columns = cols)
np.where(digits.target[test][fit.predict(dftest) > 0.5] != 7)(array([ 8, 9, 26, 29]),)np.where(digits.target[test][fit.predict(dftest) < 0.5] == 7)(array([307]),)digits.target[test][307]9not7 = 29
plt.imshow(digits.images[test][not7], cmap=plt.cm.gray_r, interpolation="nearest")
digits.target[test][not7]5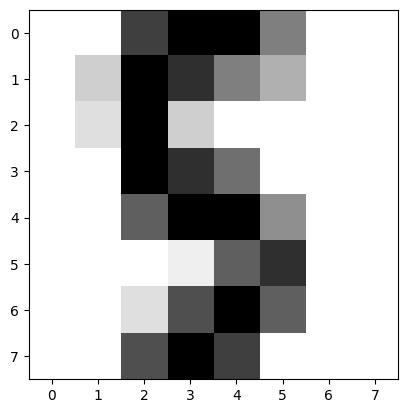
If you want to predict all digits simultaneously, I’d switch to the more sophisticated tools in Scikit-learn: scikit learn’s logistic regression
Nonetheless, much of what we did here sets you up very well for using scikit-learn’s logistic regression’s functions. For instance, the fit method on the LogisticRegression class takes two numpy arrays X and y. These can be computed as follows.
y, X = pt.dmatrices(formula, data = dftrain)