Describe the Central Limit Theorem and also include why it’s appropriate to use a symmetric confidence interval.
Consider the variable LS (litter size) from the carnivora dataset. The output of a t-test is below. Answer the following question based on this output.
carnivora <-read.csv("https://raw.githubusercontent.com/roualdes/data/refs/heads/master/carnivora.csv")t.test(carnivora$LS, mu =2, conf.level =0.9)
 One Sample t-test

data:  carnivora$LS
t = 9.87, df = 109, p-value < 2.2e-16
alternative hypothesis: true mean is not equal to 2
90 percent confidence interval:
 3.024773 3.438863
sample estimates:
mean of x
 3.231818
How many observations were measured / what is the sample size?
df + 1 = 110
Interpret, in context of these data, the confidence interval.
We are 95% confident that the true mean litter size of animals from the Order Carnivora is between 3.02 and 3.44.
Did this confidence interval capture the true population parameter it is targeting?
We don’t know. We know that the procedure used to create this confidence interval would capture the true mean 90% of the time, if we were to collect new data and make a new confidence interval from each new dataset. But this particular confidence interval, we can’t say.
If we had instead more observations in the sample, would the confidence interval be narrower or wider? Explain why, using concepts and keywords from this class.
More observations leads to increased accuracy, since the standard error decreases, and so the confidence interval will narrow.
If we instead made a 98% confidence interval, would the confidence interval be narrower or wider? Explain why, using concepts and keywords from this class.
With a greater confidence level, a confidence interval will widen because a higher confidence level will capture more of the most likely values that the true population mean could take on.
Consider again the carnivora dataset, where GL represents gestation length in days and WA represents weaning age in days. The output of a t-test is below. Answer the following questions based on this output.
 One Sample t-test

data:  carnivora$diff
t = -2.5586, df = 57, p-value = 0.01319
alternative hypothesis: true mean is not equal to 0
99 percent confidence interval:
 -69.848307   1.420721
sample estimates:
mean of x
-34.21379
What type of hypothesis test is this, what is the proper name?
paired t-test
Write the corresponding null and alternative hypotheses using proper statistical symbols.
H0: μ_diff = 0 H1: μ_diff != 0
What is the value for the level of significance?
.01
Write a statistical conclusion using the p-value.
Because the p-value is greater than the level of significance we fail to reject H0
Write an interpretation of the conclusion from d. with minimal statistical jargon.
There is evidence that the true mean difference between gestation length and weaning age in days is not different from 0.
Explain why the confidence interval supports the same conclusion as the p-value.
Becuase the confidence interval captures the value in H0, namely 0, the confidence interval agrees with the hypothesis test.
Consider again the carnivora dataset. The output of a t-test is below. Answer the following questions based on this output.
t.test(LS ~ SuperFamily, data = carnivora, conf.level =0.9)
 Welch Two Sample t-test

data:  LS by SuperFamily
t = 4.4126, df = 76.408, p-value = 3.306e-05
alternative hypothesis: true difference in means between group Caniformia and group Feliformia is not equal to 0
90 percent confidence interval:
 0.620908 1.373465
sample estimates:
mean in group Caniformia mean in group Feliformia
                3.712281                 2.715094
What type of hypothesis test is this, what is the proper name?
two sample t-test
Write the corresponding null and alternative hypotheses using proper statistical symbols.
H0: µ_c = µ_f H1: µ_c != µ_f
What does this output tell you about these data? Write a conclusion with little to no statistical jargon, citing the hypothesis test or the confidence interval to support your claim.
Because p-value < 0.0001 < α = 0.1, we reject H0. There is evidence in favor of the alternative hypothesis, that there is a difference in mean litter size between Feliformia and Caniformia.
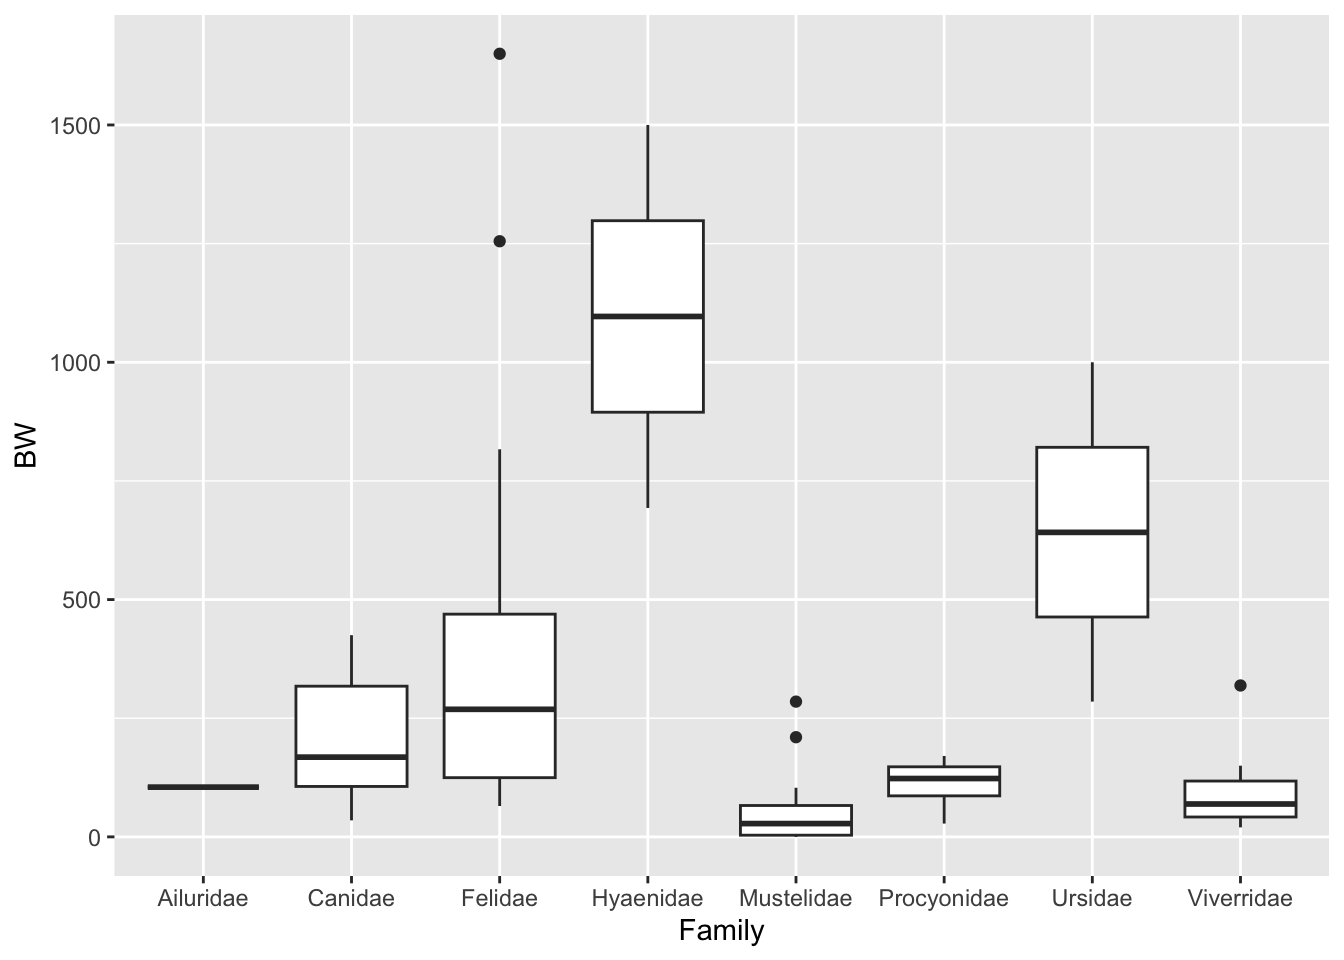
Consider again the carnivora dataset, where BW represents birth weight in grams. Based on the following code, answer the questions below.
Yes, for ANOVA, the group degrees of freedom is always the number of groups 8 minus 1 = 7.
What is the appropriate statistical conclusion from this test?
Reject H0
Write an interpretation of the conclusion with minimal statistical jargon.
There is at least one family with a mean birth weight different from the other families. Some families of the order Carnivora have different mean birth weight.
Explain why it is appropriate to use Tukey’s HSD here.
Because we rejected H0
What does Tukey’s HSD tell you about these possums?
The families Hyaenidae and Canidae have differing mean birth weight (p-value = 0.002), but the families Mustelidae and Canidae do not (p-value = 0.869).
Source Code
---toc: falseformat: html---# MATH 315 Practice Exam 02, solutions```{r}#| echo: false#| output: falselibrary(dplyr)library(ggplot2)```1. Describe the Central Limit Theorem and also include why it's appropriate to use a symmetric confidence interval.2. Consider the variable `LS` (litter size) from the carnivora dataset. The output of a t-test is below. Answer the following question based on this output.```{r} carnivora <-read.csv("https://raw.githubusercontent.com/roualdes/data/refs/heads/master/carnivora.csv")t.test(carnivora$LS, mu =2, conf.level =0.9)``` a. How many observations were measured / what is the sample size? df + 1 = 110 b. Interpret, in context of these data, the confidence interval. We are 95% confident that the true mean litter size of animals from the Order Carnivora is between 3.02 and 3.44. c. Did this confidence interval capture the true population parameter it is targeting? We don't know. We know that the procedure used to create this confidence interval would capture the true mean 90% of the time, if we were to collect new data and make a new confidence interval from each new dataset. But this particular confidence interval, we can't say. d. If we had instead more observations in the sample, would the confidence interval be narrower or wider? Explain why, using concepts and keywords from this class. More observations leads to increased accuracy, since the standard error decreases, and so the confidence interval will narrow. e. If we instead made a 98% confidence interval, would the confidence interval be narrower or wider? Explain why, using concepts and keywords from this class. With a greater confidence level, a confidence interval will widen because a higher confidence level will capture more of the most likely values that the true population mean could take on.3. Consider again the carnivora dataset, where GL represents gestation length in days and WA represents weaning age in days. The output of a t-test is below. Answer the following questions based on this output.```{r} carnivora$diff <- carnivora$GL - carnivora$WAt.test(carnivora$diff, conf.level =0.99)``` a. What type of hypothesis test is this, what is the proper name? paired t-test b. Write the corresponding null and alternative hypotheses using proper statistical symbols. H0: μ_diff = 0 H1: μ_diff != 0 c. What is the value for the level of significance? .01 d. Write a statistical conclusion using the p-value. Because the p-value is greater than the level of significance we fail to reject H0 e. Write an interpretation of the conclusion from d. with minimal statistical jargon. There is evidence that the true mean difference between gestation length and weaning age in days is not different from 0. f. Explain why the confidence interval supports the same conclusion as the p-value. Becuase the confidence interval captures the value in H0, namely 0, the confidence interval agrees with the hypothesis test.4. Consider again the carnivora dataset. The output of a t-test is below. Answer the following questions based on this output.```{r}t.test(LS ~ SuperFamily, data = carnivora, conf.level =0.9)``` a. What type of hypothesis test is this, what is the proper name? two sample t-test b. Write the corresponding null and alternative hypotheses using proper statistical symbols. H0: µ_c = µ_f H1: µ_c != µ_f c. What does this output tell you about these data? Write a conclusion with little to no statistical jargon, citing the hypothesis test or the confidence interval to support your claim. Because p-value < 0.0001 < α = 0.1, we reject H0. There is evidence in favor of the alternative hypothesis, that there is a difference in mean litter size between Feliformia and Caniformia.5. Consider again the carnivora dataset, where BW represents birth weight in grams. Based on the following code, answer the questions below.```{r}ggplot(carnivora, aes(Family, BW)) +geom_boxplot() fit <-lm(BW ~ Family, data = carnivora)anova(fit)TukeyHSD(aov(fit))``` a. Is the group degrees of freedom correct? Explain. Yes, for ANOVA, the group degrees of freedom is always the number of groups 8 minus 1 = 7. b. What is the appropriate statistical conclusion from this test? Reject H0 c. Write an interpretation of the conclusion with minimal statistical jargon. There is at least one family with a mean birth weight different from the other families. Some families of the order Carnivora have different mean birth weight. d. Explain why it is appropriate to use Tukey's HSD here. Because we rejected H0 e. What does Tukey's HSD tell you about these possums? The families Hyaenidae and Canidae have differing mean birth weight (p-value = 0.002), but the families Mustelidae and Canidae do not (p-value = 0.869).