MATH 456 Quiz 01
Given on 2026-01-20
Pen/pencil and paper. No notes. No computers.
-
What is a qualitative variable? Give a definition and two examples.
-
What is a quantitative variable? Give a definition and two examples.
-
Without calculating either the mean or the standard deviation, describe the mean and standard deviation of each data set. Compare the means and standard deviations.
a. 6, 8, 10, 12, 14
b. 2, 6, 10, 14, 18
-
Without calculating either the mean or the standard deviation, describe the mean and standard deviation of each data set. Compare the means and standard deviations.
a. 1, 3, 5, 7, 9
b. 11, 13, 15, 17, 19
-
Describe, and/or define, a standard error.
-
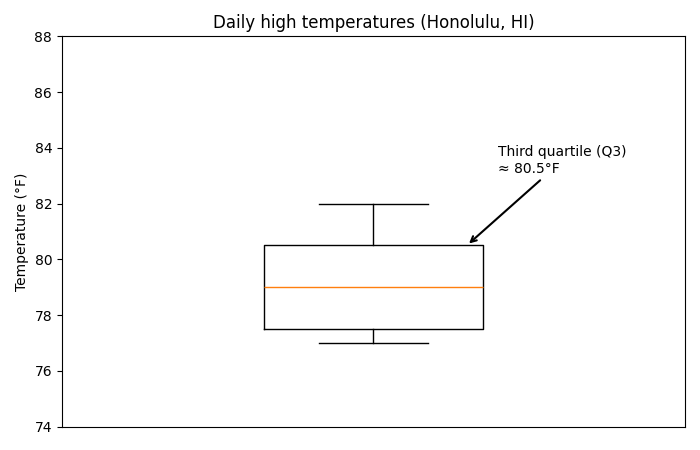
Describe the third quartile from the plot below.
-
From the plot above, what is, roughly, the value of the median and the first quartile?
-
Describe the skew of the box plot above?
-
From the daily high temperature data above, a 95% confidence interval is (77.7, 80.6) degrees F. Interpret this confidence interval in context of these data.
-
Tell me what this confidence interval means, statistically.
-
Write an
Rfor loop that sums the following numbers,4, 6, 7, 8, 10. -
Write an
Rlistthat stores an integer, a double (floating point) number, a string, and a boolean. -
Create a
data.framewith one variable that is qualitative and two variables that are both numeric. -
Make a box plot from the
data.frameyou created above. You can use baseRorggplot2. -
Make a scatter plot from the
data.frameyou created above. You can use baseRorggplot2. -
Fit linear regression using the
data.frameyou created above.